Kubernetes dashboard
Installation of the Kubernetes dashboard, metrics server, and login process.
Install kubernetes dashboard
- The chart bootstraps a Kubernetes Dashboard deployment on a kubernetes cluster using the helm package manager. Kubernetes Dashboard
- Before installation I will create
dashboard-values-ipv4.yamlin a new directory calledmanifestsas the root usermkdir ~/manifestscd ~/manifests - By default, newer versions of kong configure the networking as dual stack. As we have disabled ipv6 this will cause kong to fail with a socket error
Address family not supported by protocolunless we override the defaults. Kong is an API gateway / reverse proxy that the Kubernetes Dashboard chart can deploy alongside the Dashboard. It sits in front of the Dashboard’s services and handles the “edge” bits, TLS, HTTP(S) termination, routing, health checks, so the Dashboard can be exposed cleanly without depending on whatever ingress controller you already havevi dashboard-values-ipv4.yaml# values-ipv4.yamlkong:env:proxy_listen: "0.0.0.0:8443 http2 ssl"admin_listen: "127.0.0.1:8444 http2 ssl"status_listen: "0.0.0.0:8100"stream_listen: "off"helm upgrade --install kubernetes-dashboard kubernetes-dashboard/kubernetes-dashboard -n kubernetes-dashboard --create-namespace -f dashboard-values-ipv4.yamlRelease "kubernetes-dashboard" does not exist. Installing it now.NAME: kubernetes-dashboardLAST DEPLOYED: Sat Oct 4 07:09:01 2025NAMESPACE: kubernetes-dashboardSTATUS: deployedREVISION: 1TEST SUITE: NoneNOTES:**************************************************************************************************** PLEASE BE PATIENT: Kubernetes Dashboard may need a few minutes to get up and become ready ****************************************************************************************************Congratulations! You have just installed Kubernetes Dashboard in your cluster.To access Dashboard run:kubectl -n kubernetes-dashboard port-forward svc/kubernetes-dashboard-kong-proxy 8443:443NOTE: In case port-forward command does not work, make sure that kong service name is correct.Check the services in Kubernetes Dashboard namespace using:kubectl -n kubernetes-dashboard get svcDashboard will be available at:https://localhost:8443 - Check the kubernetes-dashboard namespace for any crashes or restarts:
kubectl get all -n kubernetes-dashboardNAME READY STATUS RESTARTS AGEpod/kubernetes-dashboard-api-59c9747755-9mlsz 1/1 Running 0 85mpod/kubernetes-dashboard-auth-64dbbdc466-xjq9q 1/1 Running 1 (66m ago) 100mpod/kubernetes-dashboard-kong-6fc959c6d8-kpdjk 1/1 Running 1 (66m ago) 100mpod/kubernetes-dashboard-metrics-scraper-547874fcf-jt5nd 1/1 Running 1 (66m ago) 100mpod/kubernetes-dashboard-web-7796b9fbbb-w5dk4 1/1 Running 1 (66m ago) 100mNAME TYPE CLUSTER-IP EXTERNAL-IP PORT(S) AGEservice/kubernetes-dashboard-api ClusterIP 10.70.191.215 <none> 8000/TCP 100mservice/kubernetes-dashboard-auth ClusterIP 10.70.189.119 <none> 8000/TCP 100mservice/kubernetes-dashboard-kong-proxy ClusterIP 10.70.130.102 <none> 443/TCP 100mservice/kubernetes-dashboard-metrics-scraper ClusterIP 10.70.148.43 <none> 8000/TCP 100mservice/kubernetes-dashboard-web ClusterIP 10.70.129.234 <none> 8000/TCP 100mNAME READY UP-TO-DATE AVAILABLE AGEdeployment.apps/kubernetes-dashboard-api 1/1 1 1 100mdeployment.apps/kubernetes-dashboard-auth 1/1 1 1 100mdeployment.apps/kubernetes-dashboard-kong 1/1 1 1 100mdeployment.apps/kubernetes-dashboard-metrics-scraper 1/1 1 1 100mdeployment.apps/kubernetes-dashboard-web 1/1 1 1 100mNAME DESIRED CURRENT READY AGEreplicaset.apps/kubernetes-dashboard-api-59c9747755 1 1 1 100mreplicaset.apps/kubernetes-dashboard-auth-64dbbdc466 1 1 1 100mreplicaset.apps/kubernetes-dashboard-kong-6fc959c6d8 1 1 1 100mreplicaset.apps/kubernetes-dashboard-metrics-scraper-547874fcf 1 1 1 100mreplicaset.apps/kubernetes-dashboard-web-7796b9fbbb 1 1 1 100m - All pods are healthy. You can check the logs of any pod:
kubectl logs pod/kubernetes-dashboard-kong-6fc959c6d8-kpdjk -n kubernetes-dashboard2025/10/04 07:29:44 [notice] 1404#0: *3 [lua] worker.lua:286: communicate(): worker #0 is ready to accept events from unix:/kong_prefix/sockets/we, context: ngx.timer2025/10/04 07:29:44 [notice] 1404#0: *644 [lua] broker.lua:270: run(): worker #0 connected to events broker (worker pid: 1404), client: unix:, server: kong_worker_events, request: "GET / HTTP/1.1", host: "localhost"
Install kubernetes dashboard metrics server
- Metrics Server is a scalable, efficient source of container resource metrics for Kubernetes built-in autoscaling pipelines. Metrics Server collects resource metrics from Kubelets and exposes them in Kubernetes apiserver through Metrics API for use by Horizontal Pod Autoscaler and Vertical Pod Autoscaler
- By default the metrics server pods will fail to scrape any metrics as TLS will fail to verify the certificate. To avoid this we will create a
metrics-values.yamlfile in the manifest directory and reference it when installing via helmvi metrics-values.yamlargs:- --kubelet-preferred-address-types=Hostname,InternalDNS,InternalIP,ExternalIP- --kubelet-insecure-tls - Install the kubernetes dashboard metrics server
helm upgrade --install metrics-server metrics-server/metrics-server -n kubernetes-dashboard -f metrics-values.yamlRelease "metrics-server" does not exist. Installing it now.NAME: metrics-serverLAST DEPLOYED: Sat Oct 4 07:44:25 2025NAMESPACE: kubernetes-dashboardSTATUS: deployedREVISION: 1TEST SUITE: NoneNOTES:************************************************************************ Metrics Server ************************************************************************Chart version: 3.13.0App version: 0.8.0Image tag: registry.k8s.io/metrics-server/metrics-server:v0.8.0***********************************************************************
- Check health of the metrics server
kubectl get all -n kubernetes-dashboardNAME READY STATUS RESTARTS AGEpod/kubernetes-dashboard-api-59c9747755-9mlsz 1/1 Running 0 89mpod/kubernetes-dashboard-auth-64dbbdc466-xjq9q 1/1 Running 1 (69m ago) 103mpod/kubernetes-dashboard-kong-6fc959c6d8-kpdjk 1/1 Running 1 (69m ago) 103mpod/kubernetes-dashboard-metrics-scraper-547874fcf-jt5nd 1/1 Running 1 (69m ago) 103mpod/kubernetes-dashboard-web-7796b9fbbb-w5dk4 1/1 Running 1 (69m ago) 103mpod/metrics-server-57dd89ff98-4xg7q 1/1 Running 0 101sNAME TYPE CLUSTER-IP EXTERNAL-IP PORT(S) AGEservice/kubernetes-dashboard-api ClusterIP 10.70.191.215 <none> 8000/TCP 103mservice/kubernetes-dashboard-auth ClusterIP 10.70.189.119 <none> 8000/TCP 103mservice/kubernetes-dashboard-kong-proxy ClusterIP 10.70.130.102 <none> 443/TCP 103mservice/kubernetes-dashboard-metrics-scraper ClusterIP 10.70.148.43 <none> 8000/TCP 103mservice/kubernetes-dashboard-web ClusterIP 10.70.129.234 <none> 8000/TCP 103mservice/metrics-server ClusterIP 10.70.155.239 <none> 443/TCP 101sNAME READY UP-TO-DATE AVAILABLE AGEdeployment.apps/kubernetes-dashboard-api 1/1 1 1 103mdeployment.apps/kubernetes-dashboard-auth 1/1 1 1 103mdeployment.apps/kubernetes-dashboard-kong 1/1 1 1 103mdeployment.apps/kubernetes-dashboard-metrics-scraper 1/1 1 1 103mdeployment.apps/kubernetes-dashboard-web 1/1 1 1 103mdeployment.apps/metrics-server 1/1 1 1 101sNAME DESIRED CURRENT READY AGEreplicaset.apps/kubernetes-dashboard-api-59c9747755 1 1 1 103mreplicaset.apps/kubernetes-dashboard-auth-64dbbdc466 1 1 1 103mreplicaset.apps/kubernetes-dashboard-kong-6fc959c6d8 1 1 1 103mreplicaset.apps/kubernetes-dashboard-metrics-scraper-547874fcf 1 1 1 103mreplicaset.apps/kubernetes-dashboard-web-7796b9fbbb 1 1 1 103mreplicaset.apps/metrics-server-57dd89ff98 1 1 1 101s
Login to the dashboard
-
Create a seperate admin for the dashboard. Use a dedicated ServiceAccount (don’t grant cluster-admin to the dashboard’s own SA)
- Create the ServiceAccount
cat << 'EOF' | kubectl apply -f -apiVersion: v1kind: ServiceAccountmetadata:name: admin-usernamespace: kubernetes-dashboardEOFserviceaccount/admin-user created -
Bind admin-user to cluster-admin
cat << 'EOF' | kubectl apply -f -apiVersion: rbac.authorization.k8s.io/v1kind: ClusterRoleBindingmetadata:name: admin-userroleRef:apiGroup: rbac.authorization.k8s.iokind: ClusterRolename: cluster-adminsubjects:- kind: ServiceAccountname: admin-usernamespace: kubernetes-dashboardEOFclusterrolebinding.rbac.authorization.k8s.io/admin-user created -
Get a login token
kubectl -n kubernetes-dashboard create token admin-user --duration=24heyJhbGciOiJSUzI1NiIsImtpZCI6Ik9zSERseW1GZUtxNC1PSWRyZ3c3eWZjX2NWNXpySjdlVU1SeGtmRnp3cDAifQ.eyJhdWQiOlsiaHR0cHM6Ly9rdWJlcm5ldGVzLmRlZmF1bHQuc3ZjLmRldi5yZWlkcy5uZXQuYXUiXSwiZXhwIjoxNzU5NTY3OTUxLCJpYXQiOjE3NTk1NjQzNTEsImlzcyI6Imh0dHBzOi8va3ViZXJuZXRlcy5kZWZhdWx0LnN2Yy5kZXYucmVpZHMubmV0LmF1IiwianRpIjoiYzBmOTE2MDEtYzk5Ni00NTM1LTg2ZDktY2U4MGU3NTNjY2IwIiwia3ViZXJuZXRlcy5pbyI6eyJuYW1lc3BhY2UiOiJrdWJlcm5ldGVzLWRhc2hib2FyZCIsInNlcnZpY2VhY2NvdW50Ijp7Im5hbWUiOiJhZG1pbi11c2VyIiwidWlkIjoiNTBhMmFjYmEtMWM3Yi00MTYwLWI0NjAtNjMzNzQ3NmYzYjI0In19LCJuYmYiOjE3NTk1NjQzNTEsInN1YiI6InN5c3RlbTpzZXJ2aWNlYWNjb3VudDprdWJlcm5ldGVzLWRhc2hib2FyZDphZG1pbi11c2VyIn0.x1Putn9grjORAOIyQ__Iey5RFPOq-L5DHMUYDuVsgjwLbImsR5hUc2_uweKGChBiZy1HVu2jxbxHsQ1zcegPZ3a9U5feAJs6ptnPbFqqIABFSAnv7QKT0vix7Je_h6Xjt26DrGZCS0GQ4c9Cmrih2lY8mL8RPqcr1wNNS_I4nnmBbAB3BTFle0wGC1h729mjxxBn_dRKGj0CM-tHpAHxBVEvUxyEap1VF6lnbSaOvge-g0cjQ9EpUXSzxwr8Wz4D5ynaP7Q-LtKU8BiCPX3Kh6FkyvTR1W8kkL2-a2Kixl2hwlpxpP8BdCvgcvZ7gg9P4PAsNieNWr-SHL8rQhQ2Zw- Note that the default duration before the token expires is 1 hour. This can be increased to 24 hours with the --duration=24h flag:
kubectl -n kubernetes-dashboard create token admin-user --duration=24h - If the API server does not have --service-account-max-token-expiration set then Kubernetes uses the default max, which is 24 hours, even if you configure the token expiry longer
- Note that the default duration before the token expires is 1 hour. This can be increased to 24 hours with the --duration=24h flag:
-
Connect to the master node over a new SSH terminal session:
ssh dev@master-1.internal.example.com- Change user to root and execute:
kubectl -n kubernetes-dashboard port-forward svc/kubernetes-dashboard-kong-proxy 8443:443Forwarding from 127.0.0.1:8443 -> 8443Handling connection for 8443
- Change user to root and execute:
-
As the internal pod IP address is not directly routable, open a new terminal and establish a tunnel to the master node running the port forwarding:
ssh -A dev@192.168.1.203 -L 8443:127.0.0.1:8443- ssh: Open a secure connection to another machine.
- -A: Forward your SSH agent. Handy if you need your keys on the master later, not required for the tunnel itself.
- dev@192.168.1.203: Log in to the master node as user dev.
- -L 8443:127.0.0.1:8443: Create a local tunnel. Anything you send to your laptop’s localhost:8443 is carried through the SSH connection and delivered to the master’s 127.0.0.1:8443.
-
Because the master is already running kubectl port-forward to the pod on its own 127.0.0.1:8443, your traffic reaches the pod even though its IP is not routable from your laptop.
-
Open a browser and enter https://localhost:8443/ in the address bar
- Copy and paste the bearer token from the other session
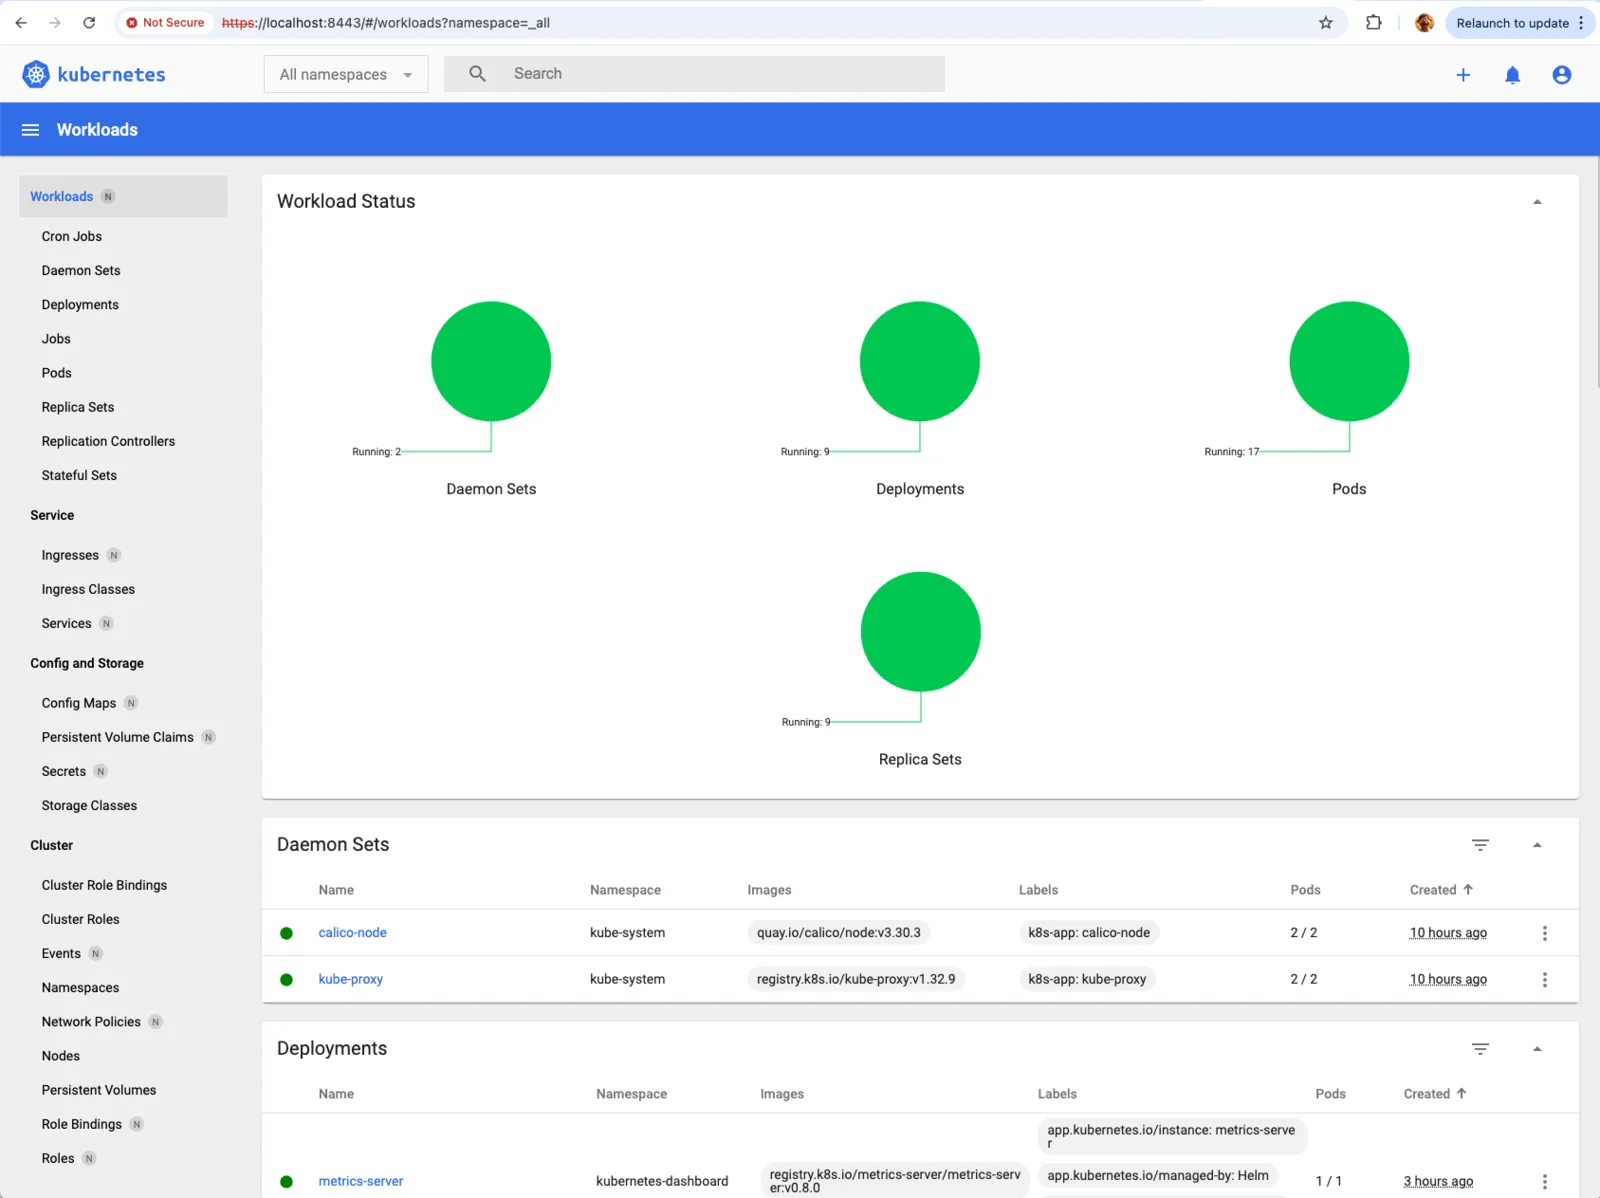
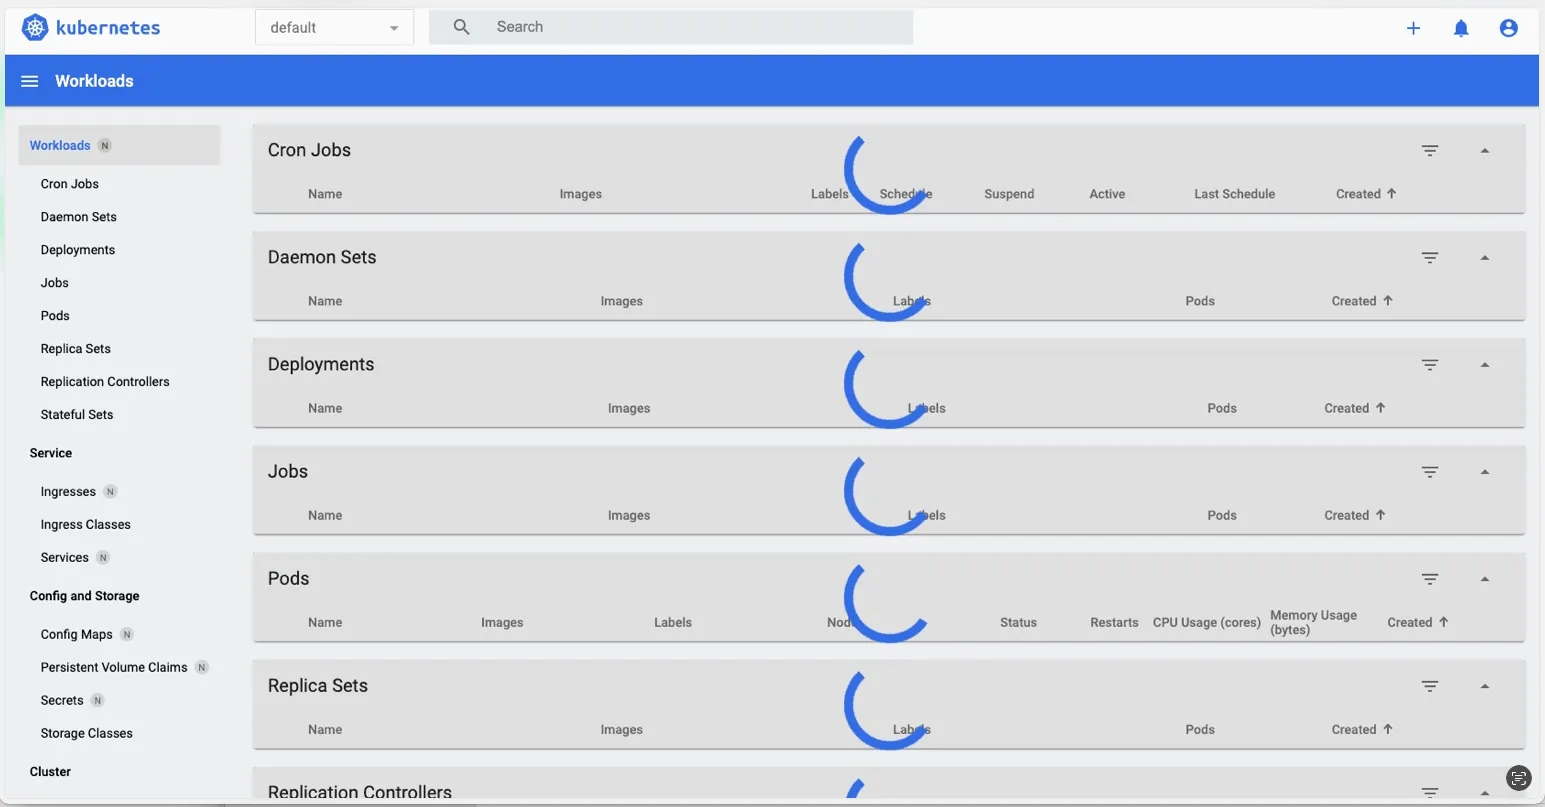
- At initial login the default namespace will be shown, but there will no workloads shown as we haven't created any in that namespace
- From the dropdown menu select
All namespacesand the workload status will be shown
- If you can login to the dashboard but no information is shown followed by a HTTP failure response (502) error you may have a resource issue
- Investigating the dashboard events can reveal the underlying cause
kubectl -n kubernetes-dashboard get events --sort-by=.lastTimestamp | tail -n 30
Events:
       Type     Reason            Age                From               Message
       ----     ------            ----               ----               -------
       Warning  FailedScheduling  16m                default-scheduler  0/2 nodes are available: 1 Insufficient memory, 1 node(s) had untolerated taint {node-role.kubernetes.io/control-plane: }. preemption: 0/2 nodes are available: 1 No preemption victims found for incoming pod, 1 Preemption is not helpful for scheduling.
- The resolution for this type of issue is to allocate more memory to the worker node.
- If port 8443 is busy on your laptop, change the first number, for example -L 9443:127.0.0.1:8443, then use https://localhost:9443.
- If you see “address already in use”, pick another local port.
- If you see “connection refused”, check that the kubectl port-forward is running on the master and listening on 127.0.0.1:8443.