Flow Control
Flow Control is a self-hosted support tool for health (sleep) and performance (coding) that predicts readiness and load dynamically. It visualises flow intensity on a time-series chart computed from real coding signals.
Flow Control series
- Flow Control - You are here
- Architecture
- Cursor sync daemon
- Music sync daemon
- Health sync daemon (disabled)
- HealthSync iOS app (recommended)
- Deployment
Flow philosophy
The breakthrough
I had never experienced a state of flow in my life before. Only in the last two weeks, and only in the last week did I start talking about being in flow. What changed?
1. Friction disappeared between thought and execution.
Last year I spent 5-6 months building a coaching platform with my Cursor AI assistant (Opus 3.5). After all that time and energy, working on a single project, it was (a) not deployed to production on my cluster, (b) full of bugs, and (c) only ran when I started it from a terminal.
Today the basics just work. I don't have to waste energy on the foundations of an app. I have an idea at breakfast and by lunchtime it is a fully working application in production on my cluster. That removal of friction is what unlocked flow. The more I create, the more ideas I have, and the more I create.
2. Ideas were always there. They were just blocked.
I didn't realise I had so many ideas. I think that was because the basics took so long to get working and any big change took months. When execution catches up with imagination, ideas stop being a backlog and start being fuel.
3. A capture system keeps momentum alive.
I created an Apple Reminders list called "Ideas" just over a week ago. I use my Apple Watch, CarPlay, and iPhone to dictate ideas with just a couple of key words, on a run, in the car, wherever. Later I flesh out those few words into something tangible and make it work. The ideas list spans code, newsletters, beliefs, stories about motorbikes, a hamster's escape, grief, burnout, a Steven Pinker book. The flow state is spilling across my entire life.
What this means for the visualisation
The textbook Csikszentmihalyi model assumes a stable person adjusting challenge and skill for a single activity. My experience is fundamentally different.
The flow isn't coming from a balance between challenge and skill -- it's coming from the removal of friction between thought and execution. That is not a shift on a 2D grid. It is a state change, like water going from ice to steam.
The 2D grid was designed for "am I bored or anxious at this one task." I am not doing one task. I am in a state where ideas generate more ideas and execution generates more execution. That is momentum, and momentum lives on a timeline, not a scatter plot.
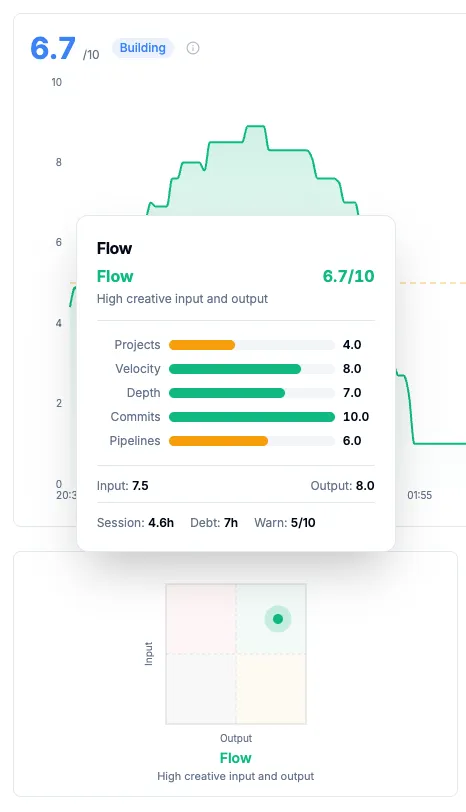
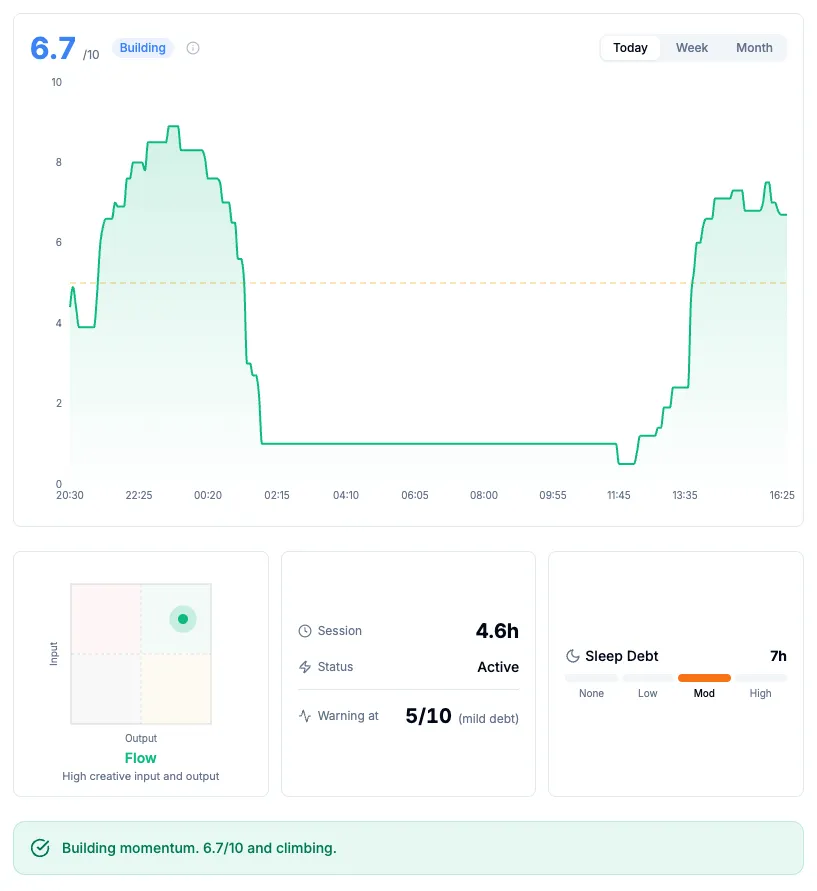
This is why Flow Control uses a time-series chart as the primary visualisation. The composite flow score spikes when multiple projects are active in parallel, request velocity is high, sessions are deep, and commits are flowing constantly. When all of those converge, that is a 9 or 10. Light single-project work after a break is a 3 or 4, not bad, just not flow.
Early warning and sleep debt
Flow does not end suddenly. It degrades. The warning signs are velocity drops, narrowing to a single project (stuck rather than flowing), long gaps appearing between requests, and error cycling (high requests but no commits).
Sleep debt does not prevent flow. I have proven that. But it shortens the runway. With good sleep, flow might sustain for 10+ hours. With 25 hours of debt, the cliff might come at 4-5 hours. The warning threshold in Flow Control triggers earlier when sleep debt is high:
| Sleep Debt | Warning Threshold | Rationale |
|---|---|---|
| < 5h | 4/10 | Can sustain longer |
| 5-15h | 5/10 | Moderate reserves |
| 15-25h | 6/10 | Warn earlier, crash steeper |
| 25h+ | 7/10 | Any dip below peak worth flagging |
The default view is Today with a live growing line. Week and Month views are toggleable retrospective views for learning limits over time. "You crashed hard on Tuesday after 7h with high debt."
What this is
I track my work activity and health obsessively, not because I have to, but because I want to understand my patterns. When am I most productive? When should I stop? Am I burning out?
Cursor AI generates detailed usage data: every request, every model, every token. But this data is locked in their cloud with no easy export. GitLab has pipeline data but in a different silo. Apple Health has sleep and activity data but cannot connect to work metrics. I needed everything in one place.
What started as a simple cost tracker became a flow state predictor. The dashboard now answers questions like:
- "Am I in flow or just busy?"
- "Should I keep working or take a break?"
- "How much have I spent on AI this billing period?"
- "Is my sleep debt affecting my performance?"
The problem I solved
| Data Source | Challenge | Solution |
|---|---|---|
| Cursor AI | No official API, auth token locked locally | Local daemon reads token, calls undocumented API |
| GitLab | Separate system, different timestamps | CronJob imports every 15 minutes |
| Apple Health | No direct export, locked in iOS | HealthSync iOS app syncs directly |
| Apple Music | No export API, only accessible on Mac | Local daemon polls via JXA every 15 seconds |
| K8s Deployments | Scattered across namespaces | CronJob aggregates deployment data |
What I built
| Feature | Description |
|---|---|
| Flow Timeline | Time-series flow score chart with Today/Week/Month toggle, per-day warning threshold (Week/Month views), radar tooltip |
| Flow Score Engine | Composite 0-10 score from 5 coding signals (parallelism, velocity, depth, commits, pipelines) |
| Flow Badge | 2D grid showing creative input vs output position with rich tooltip |
| Readiness Indicator | 10-segment bar combining sleep, debt, and exercise into a 0-10 readiness score |
| Sleep Debt Tracking | 14-day rolling window with interactive chart, split-colour gradient (red debt, green surplus), rich hover tooltips, green/red dot per night |
| AI Health Insights | Configurable AI health coach with 10+ provider types (OpenAI, Anthropic, Gemini, Ollama, and more) and editable prompt templates via /settings |
| Exercise Goals | Configurable goals (e.g. parkrun every Saturday) with CRUD UI, readiness prediction, Slack alerts |
| Billing Cycle Tracking | Aligned to Cursor's billing, navigate between periods, usage forecasting |
| Cursor CSV Import | Header-driven parser that tolerates new Cursor columns, corrects historical costs (authoritative upsert) |
| Slack Alerts | Event-driven daily flow summary, goal reminders, goal completion alerts to #flow channel |
| Sleep Tracker Picker | Select authoritative sleep source (Oura, Apple Watch, iPhone, AutoSleep) to prevent multi-source data corruption |
| Apple Watch App | 6 screens (flow gauge, health, today, decision, budget, status) with offline caching and 5 endpoint status dots |
| HealthSync Workout Distance | iOS app reads HKWorkout.totalDistance; running, cycling, walking show distance (1dp) in goals and Slack alerts |
| Watch Face Complication | Flow score, quadrant state (Flow/Stuck/Autopilot/Resting), sleep debt, active hours visible on watch face |
| Music Page | Listening history with flow correlations, Last Played column (sortable, default newest), flow-building tracks, period toggle |
| Music Sync Daemon | Local daemon polls Apple Music via JXA, buffers events, flushes to dashboard, maintains 3 dynamic playlists via incremental sync |
| Flow Timeline Music Overlay | Hovering over flow timeline shows what track was playing at that moment |
| Multi-source Import | GitLab, Cursor, K8s, Health, Music data in one place |
| Alert System | Cost discrepancies and data source health monitoring |
The numbers
- 5 flow signals: Parallelism, velocity, depth, commits, pipelines
- 5 data sources: Cursor, GitLab, K8s deployments, Apple Health, Apple Music
- 10+ AI provider types: OpenAI, Anthropic, Gemini, Ollama, Groq, Cerebras, and more
- 2 active local daemons: cursor-sync (5 min with daily full re-sync), music-sync (15s poll / 2min flush / 10min playlist sync); health-sync disabled Feb 2026
- 2 CronJobs: GitLab/commits (15 min), K8s deployments (30 min)
- 1 iOS app: HealthSync on the App Store for real-time health data sync
- 1 watchOS app: Apple Watch companion with 6 screens, 5 endpoint status dots, and watch face complication
- 43+ tools: MCP integration for AI assistants
- 100% self-hosted: All data stays on your infrastructure
Quick start
The dashboard requires:
- Kubernetes cluster with Flux GitOps
- PostgreSQL database (dedicated or shared)
- Local Mac for cursor-sync daemon (reads Cursor's auth token)
- HealthSync iOS app (recommended for health data)
# Clone the repository
git clone https://your-gitlab.example.com/tools/stats-dashboard.git
cd stats-dashboard

# Deploy to Kubernetes
flux reconcile kustomization stats-prod -n flux-system

# Install cursor-sync daemon on your Mac
cd ~/Projects/tools/cursor-sync
npm install && npm run build
launchctl load ~/Library/LaunchAgents/com.example.cursor-sync.plist
See Deployment for detailed instructions.
Why I built it myself
I cannot trust cloud services with this data. My work patterns, AI usage, health metrics, and productivity cycles are deeply personal. When combined, they paint an intimate picture of my life.
Every commercial dashboard I evaluated wanted to send my data to their cloud. I needed something that runs entirely on my infrastructure with no external dependencies.
The combination of Cursor and Claude made building it fast. The first version was working within a day. Iteration continued for weeks as I discovered what questions I actually wanted answered.
How these pages are organised
Each section follows a similar structure:
- Context. Why this piece exists and what problem it solves.
- How it works. Technical explanation with diagrams.
- Step-by-step. Numbered instructions for reproduction.
- Configuration. Code blocks with settings.
- Troubleshooting. Common issues and solutions.
Source code
The dashboard and daemons are available on GitLab:
- Dashboard:
https://your-gitlab.example.com/tools/stats-dashboard - Cursor sync:
https://your-gitlab.example.com/tools/cursor-sync - Music sync:
https://your-gitlab.example.com/tools/music-sync - Health sync:
https://your-gitlab.example.com/tools/health-sync
Replace your-gitlab.example.com with your GitLab instance.